A Smarter Way to Analyze Companies
We designed Narumi AI to be powerful, intuitive, and focused on what truly matters.
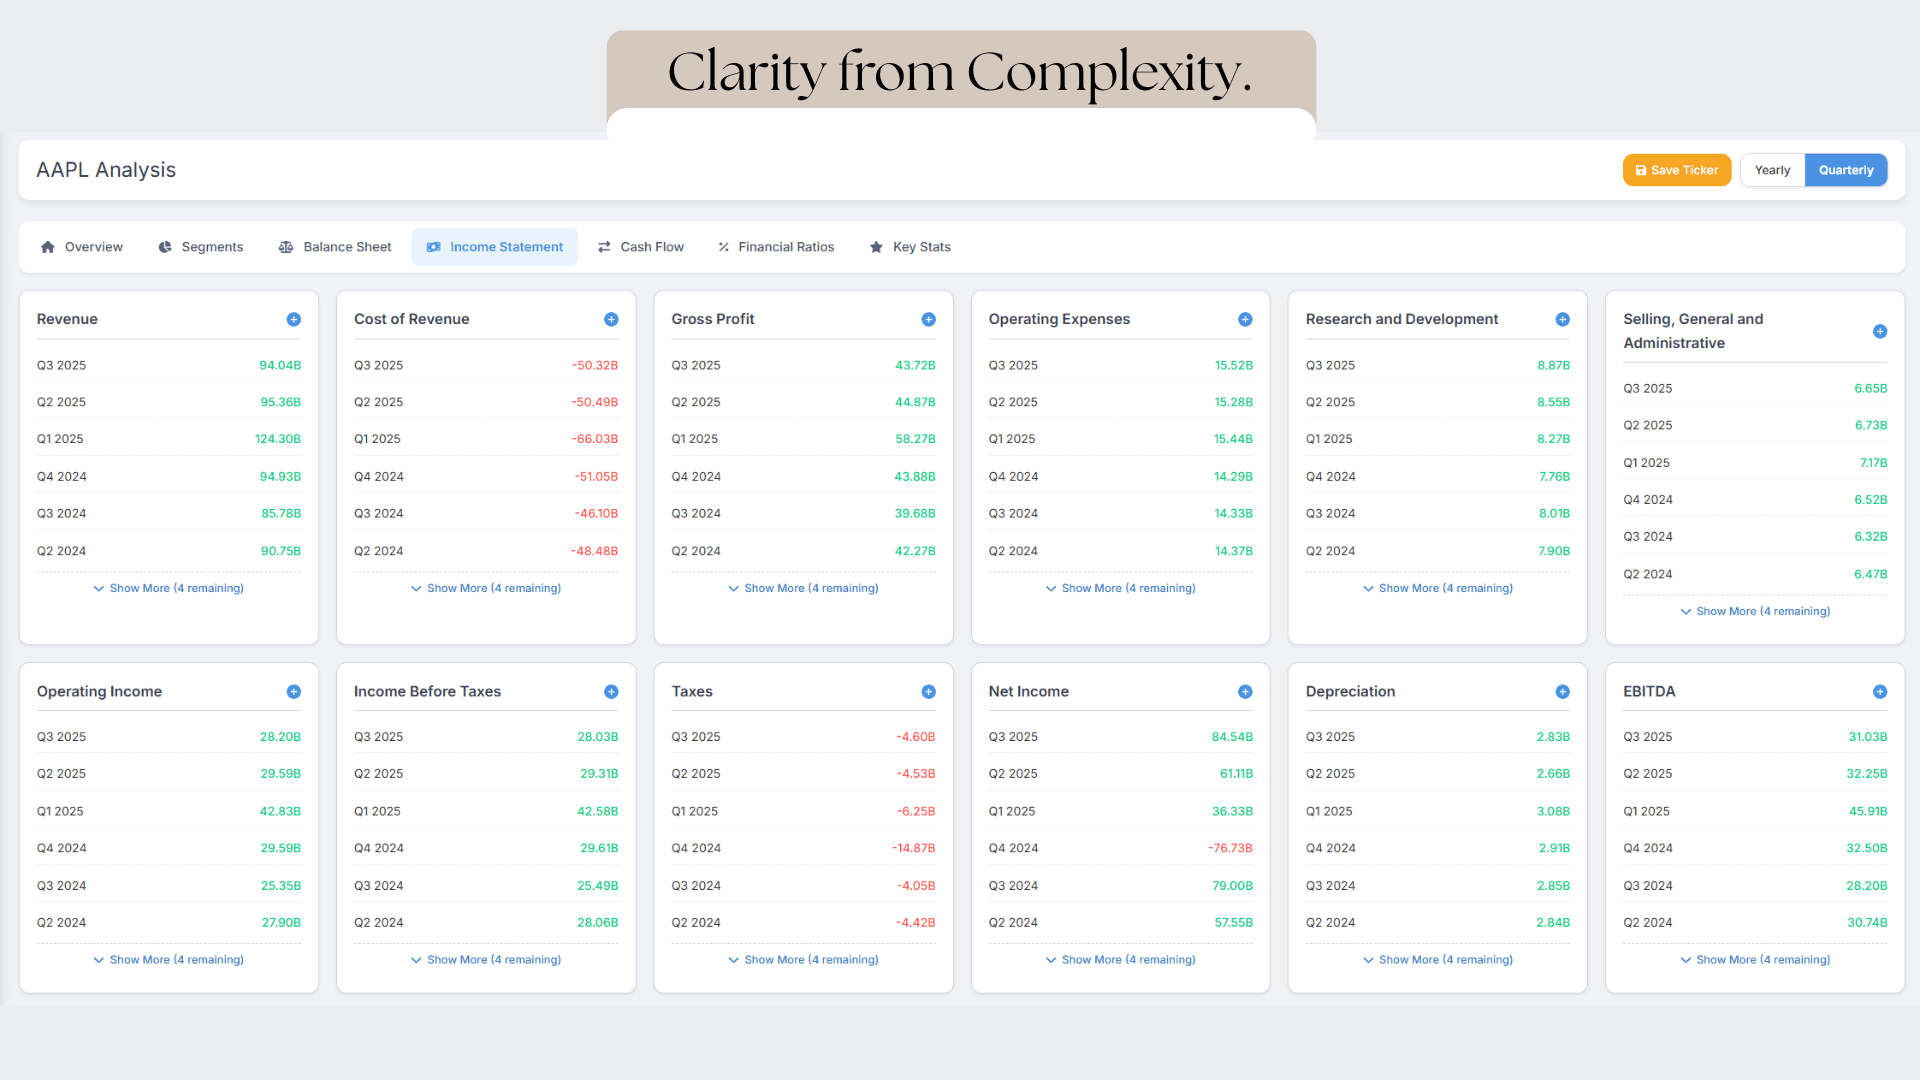
See the Full Financial Story
Go beyond the surface. We arm you with years of in-depth financial statements, KPIs, and critical ratios, so you can uncover the full story behind any company. No more digging through endless filings.
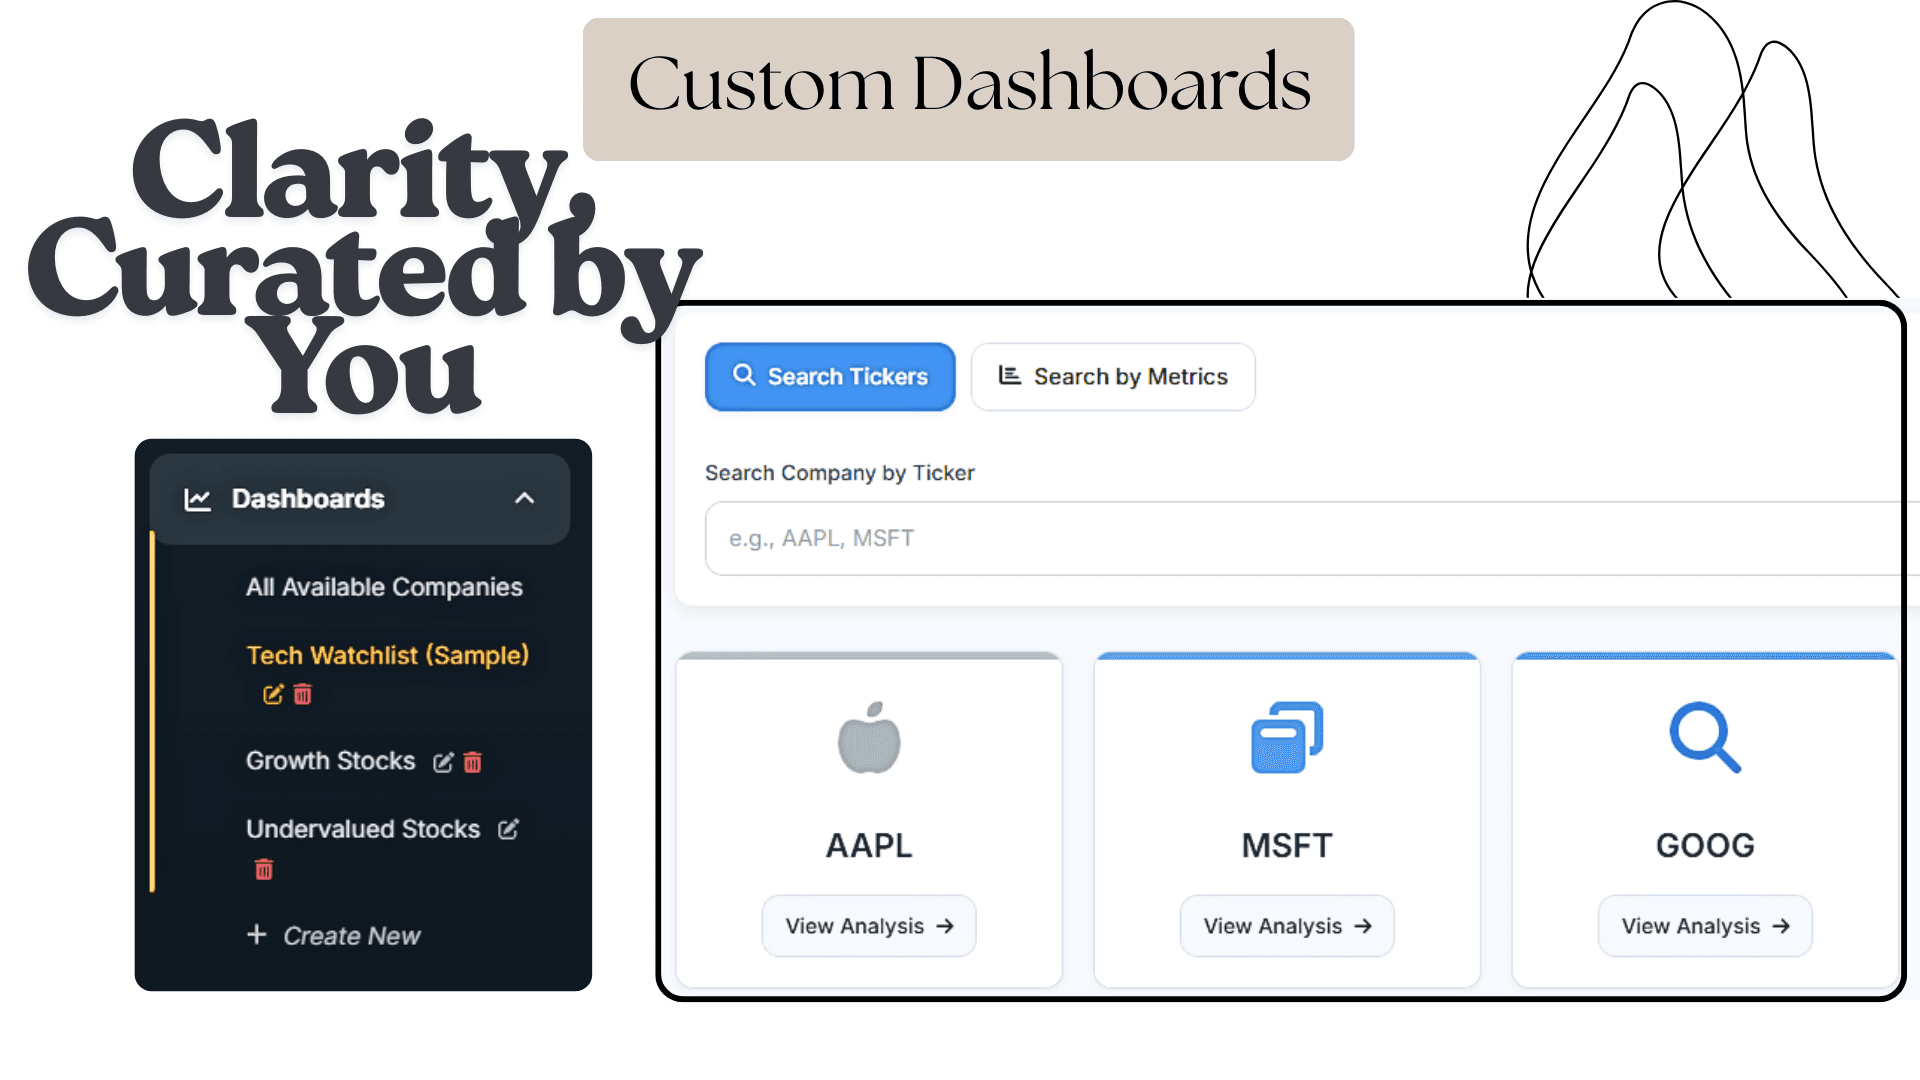
Customizable Dashboards
Create your own corner of the market. Design beautiful, personalized dashboards to focus your research and monitor the companies you care about, all in one place.
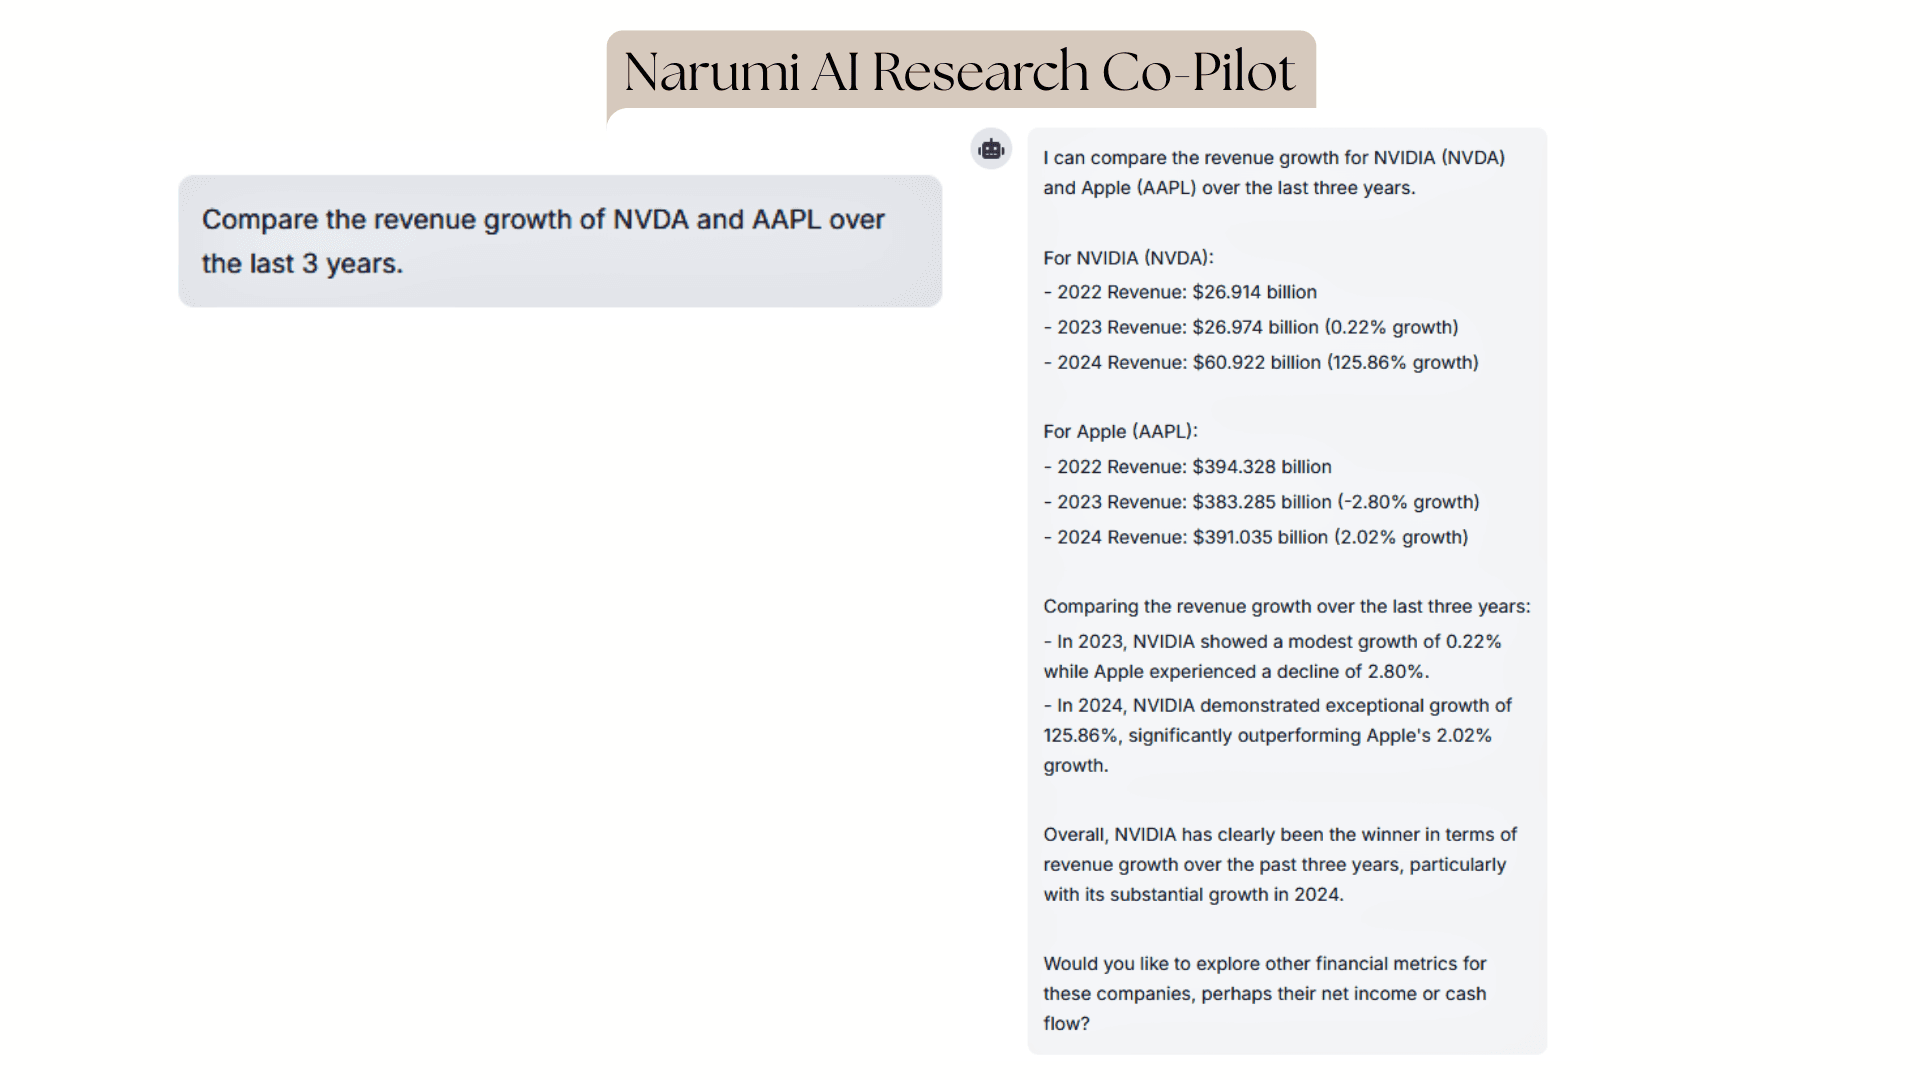
Your Personal AI Research Co-Pilot
Ask complex questions in plain English. Our AI cuts through complexity to highlight emerging trends, summarize performance, compare competitors, and accelerate your analysis from hours to minutes.
Find Top Performers Instantly
Don't just look at one company. Search the entire market by key metrics like 'Revenue' or 'Net Income' to instantly rank companies and discover who's leading the pack.

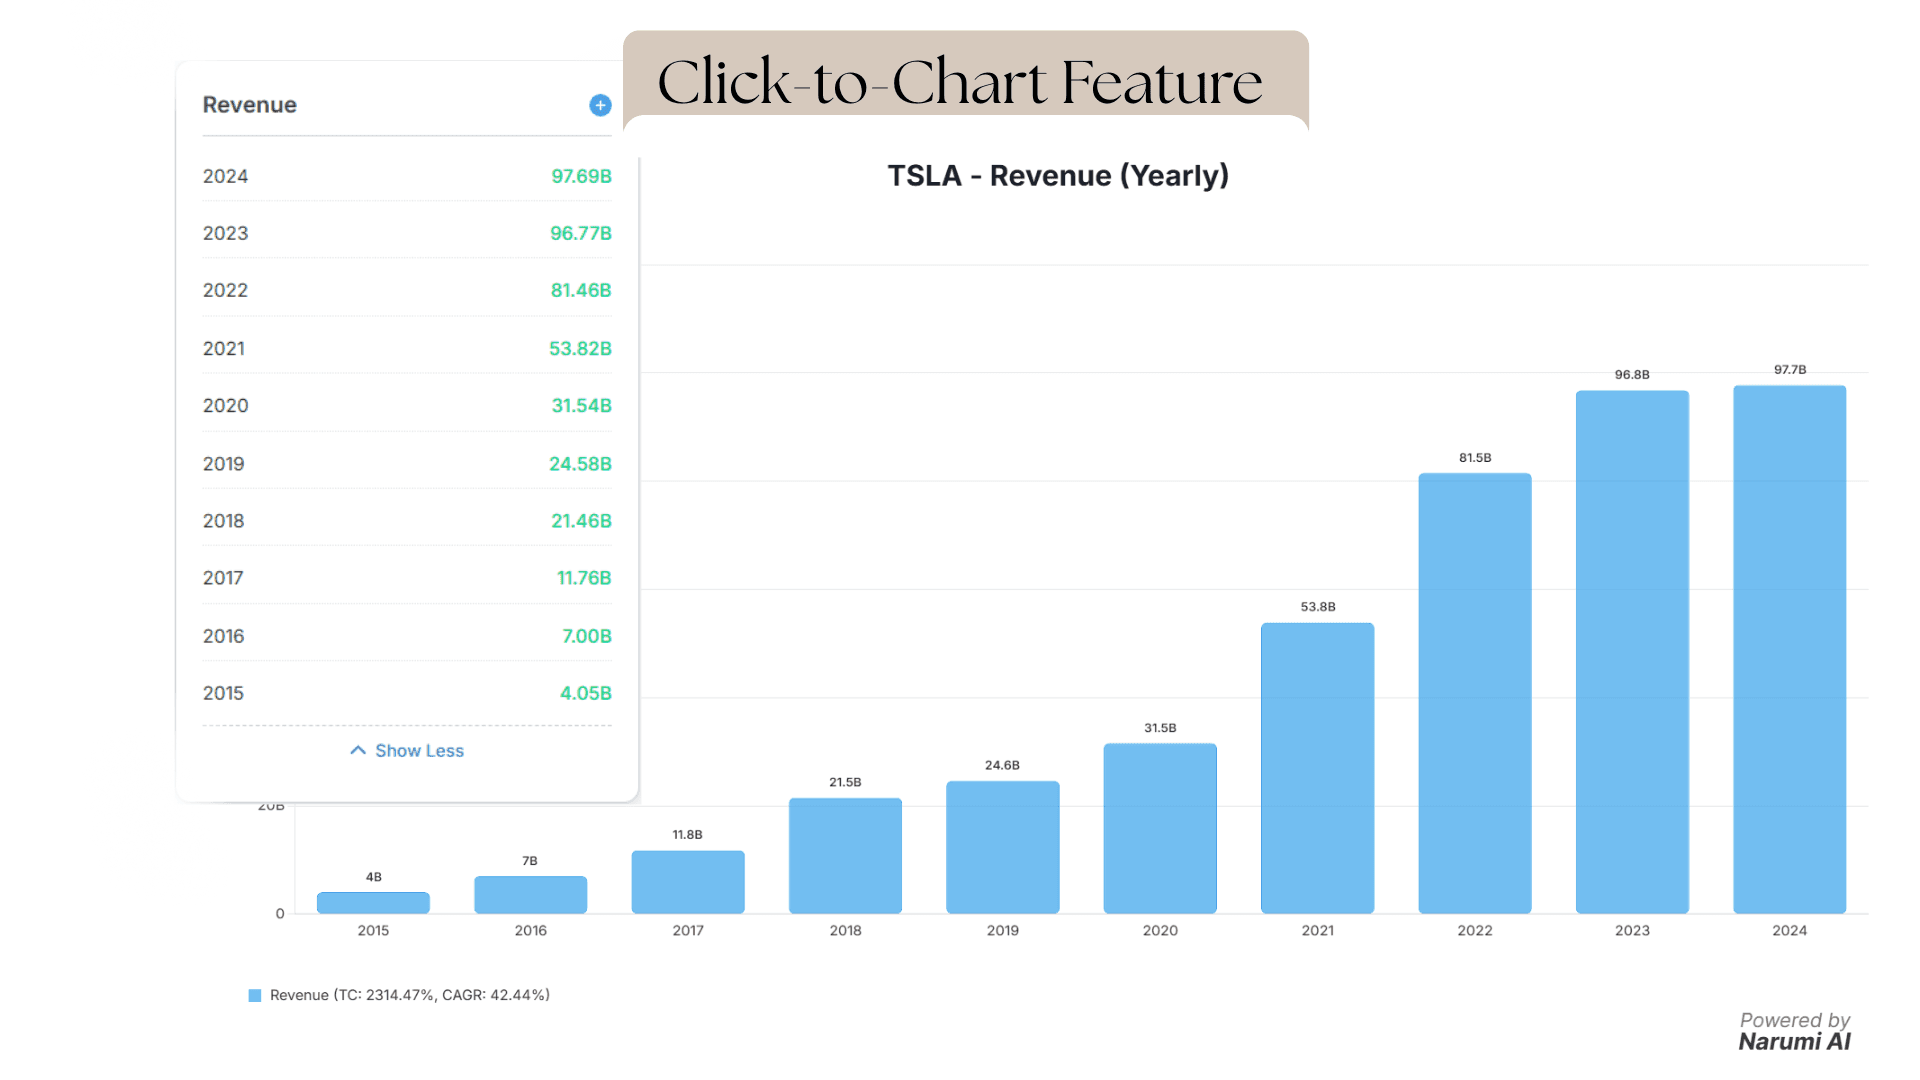
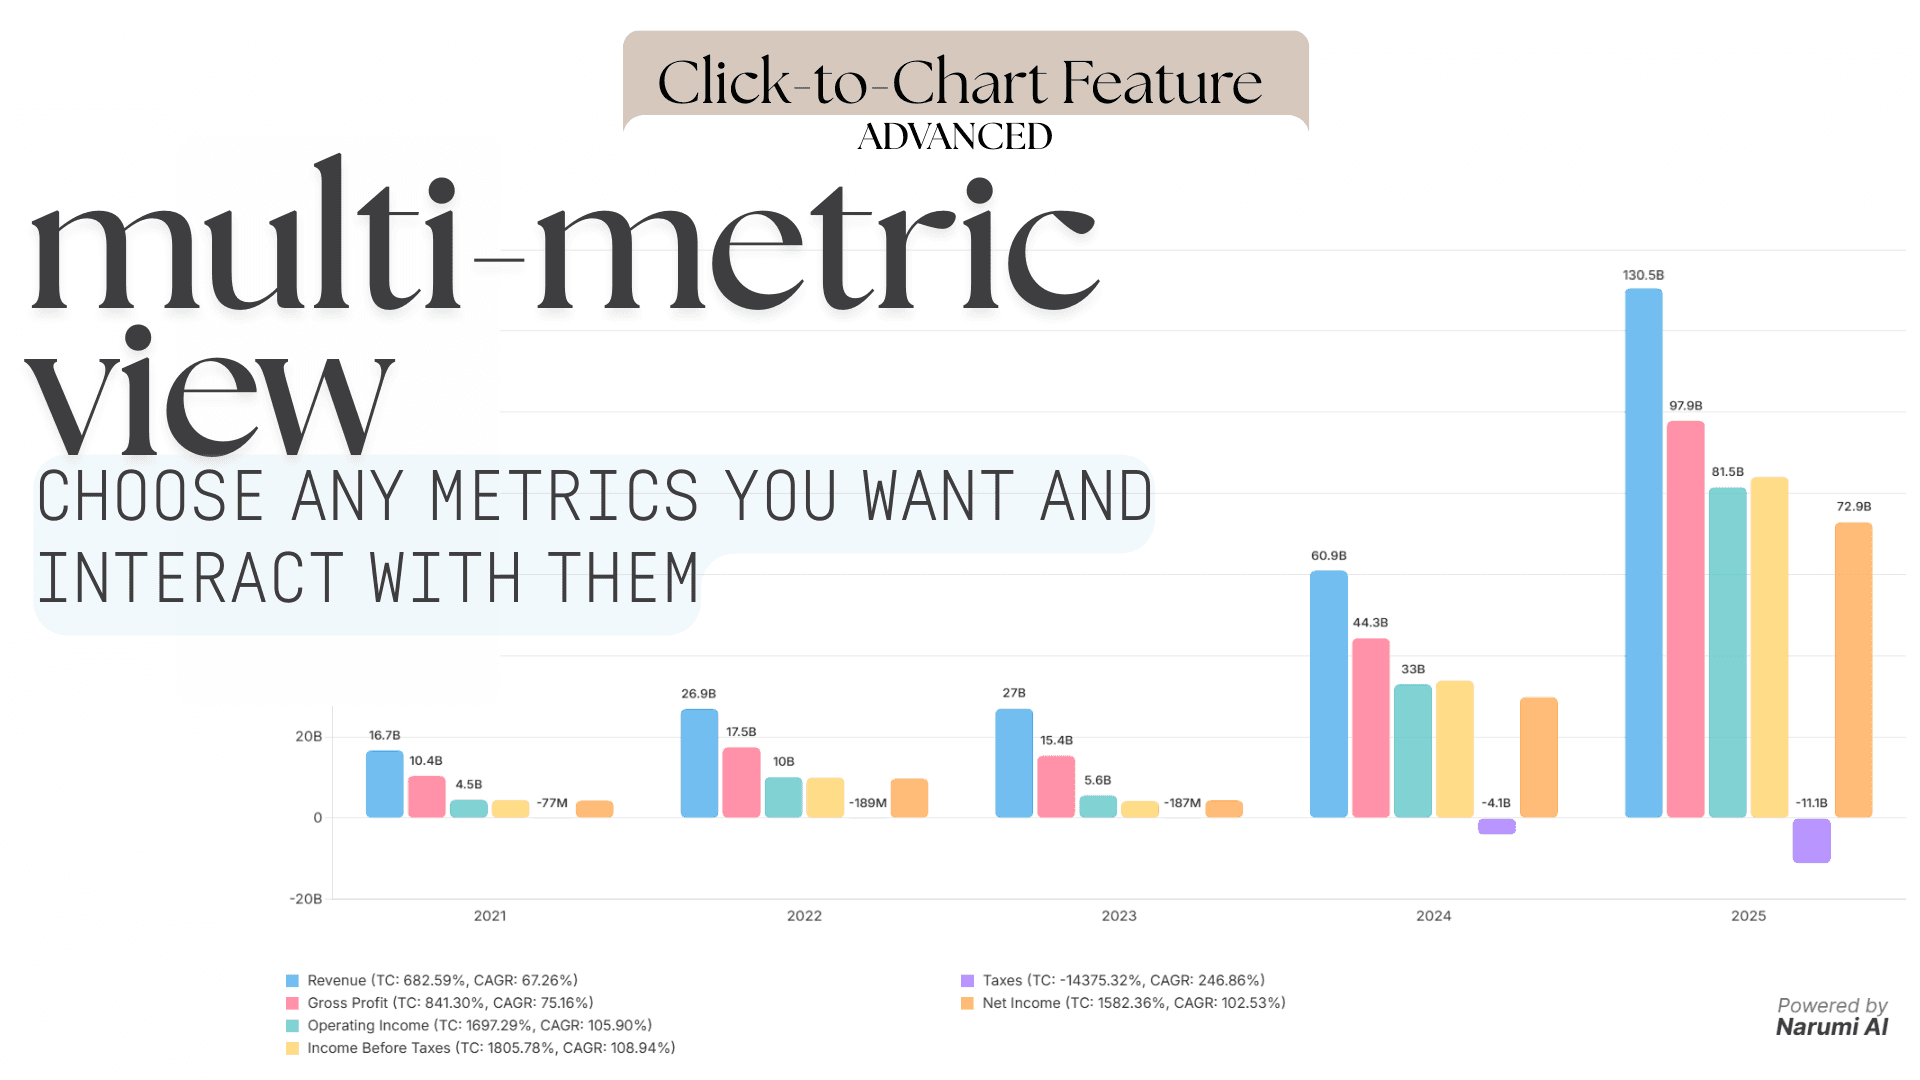
Bring Every Number to Life
Static spreadsheets are a thing of the past. With Narumi AI, every single data point on our platform is a gateway to deeper understanding. See a number you're curious about? Just click. Instantly visualize years of historical performance and see the story behind the data.
- Click any metric to generate a beautiful, interactive chart instantly.
- Layer multiple metrics to uncover hidden correlations and trends.
- Seamlessly switch between yearly and quarterly views to change your perspective.
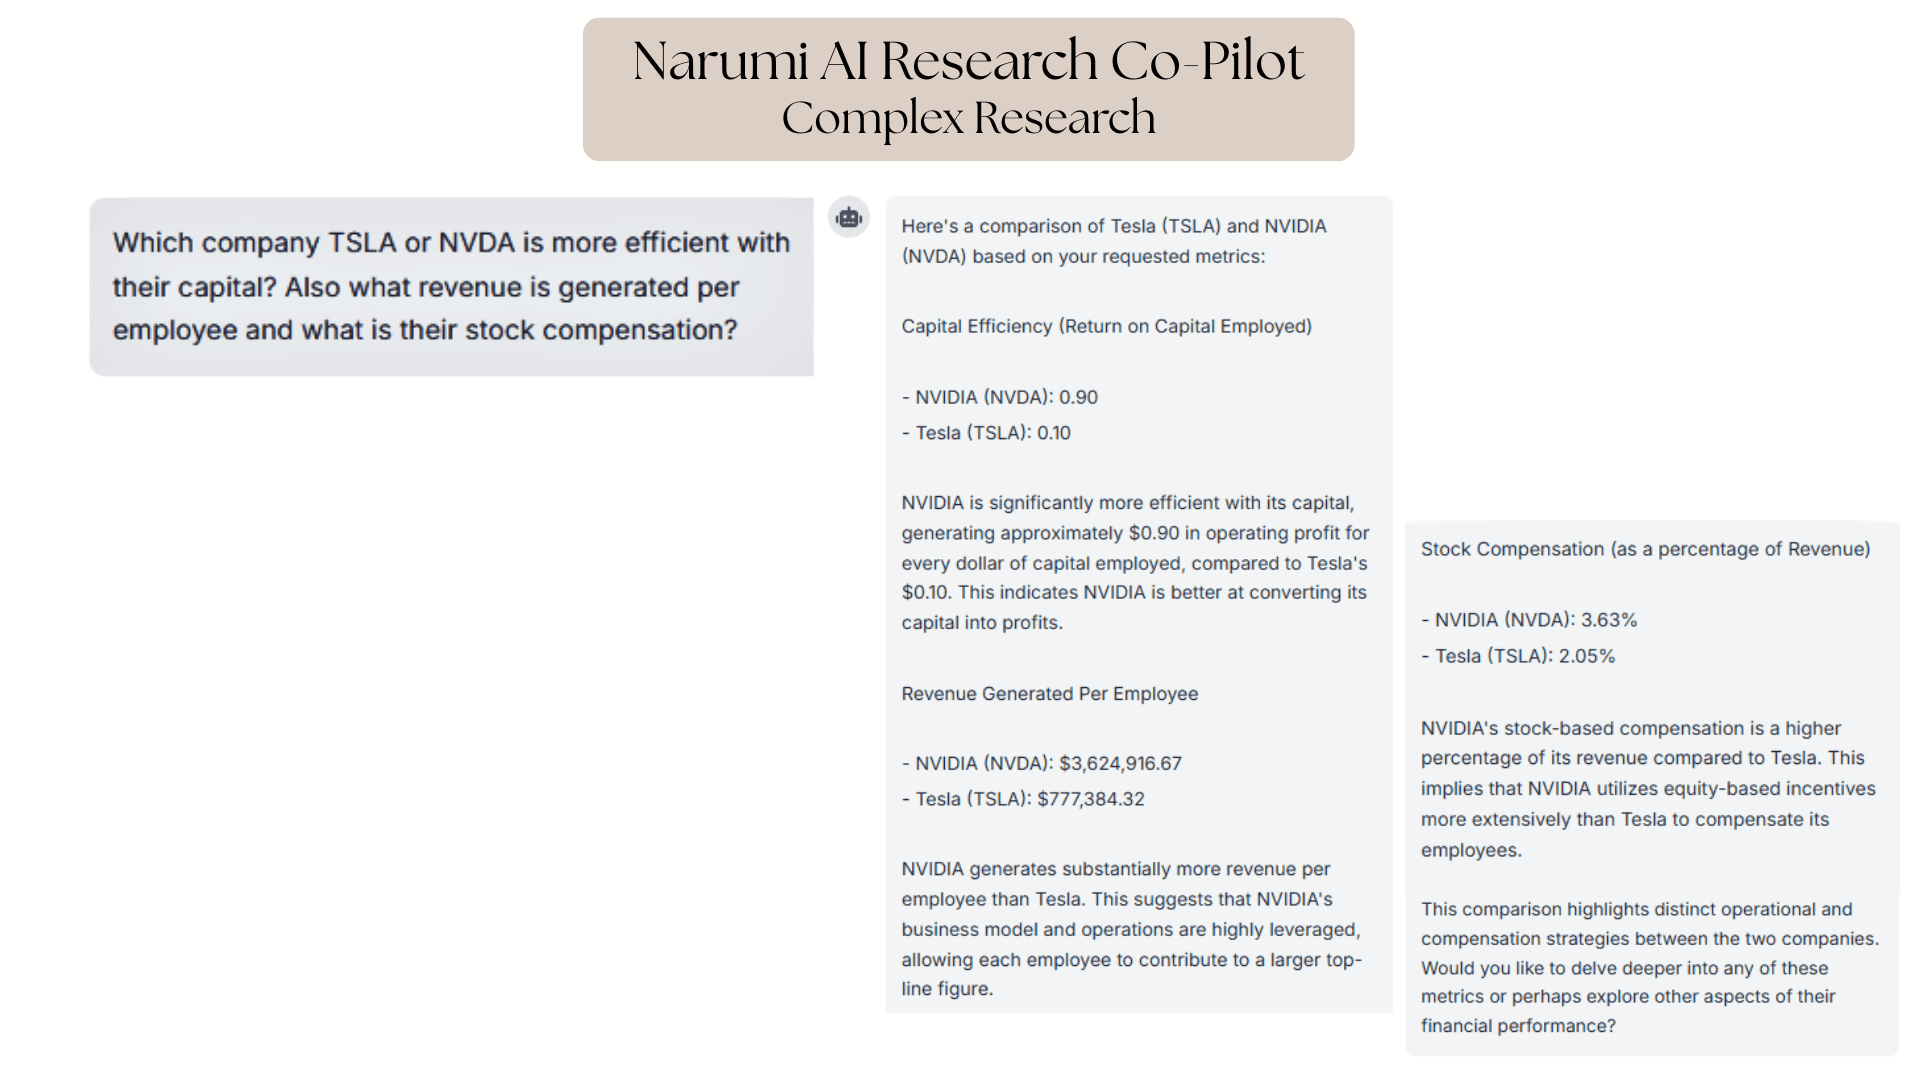
Ask Your Toughest Questions
Stop spending hours reading dense reports. Our AI analyst does the heavy lifting for you. Ask it to analyze a company's entire financial health, and it will provide a comprehensive, easy-to-read summary. Better yet, pit stocks against each other and ask, "Who has better margins?" or "Compare NVDA and AMD's revenue growth." Get immediate, data-backed answers and make smarter decisions, faster.
- Ask for a full performance summary and get a human-like report in seconds.
- Instantly compare key metrics like profitability and growth across multiple companies.
- Go beyond and understand the 'why' behind the numbers with AI-driven explanations of what happened and why.
Built for Clarity
Narumi AI was born from a simple idea: financial analysis shouldn't be confusing. Our goal is to make complex company data easy for everyone to access, understand, and use.

Yani
Founder & CEO
I started Narumi AI because I was frustrated with overly complex tools. I wanted to build something intuitive and powerful that I would love to use every day.
Follow on TwitterThe Narumi AI Project
Our Mission in Action
We're obsessed with transforming dense financial reports into clear, actionable insights. Our goal is to level the playing field for every investor, from beginner to pro.
Follow our JourneyFrequently Asked Questions
Find answers to common questions about Narumi AI, our features, and how we operate.
Ready to Elevate Your Financial Analysis?
Join Narumi AI today and transform the way you interact with financial data.